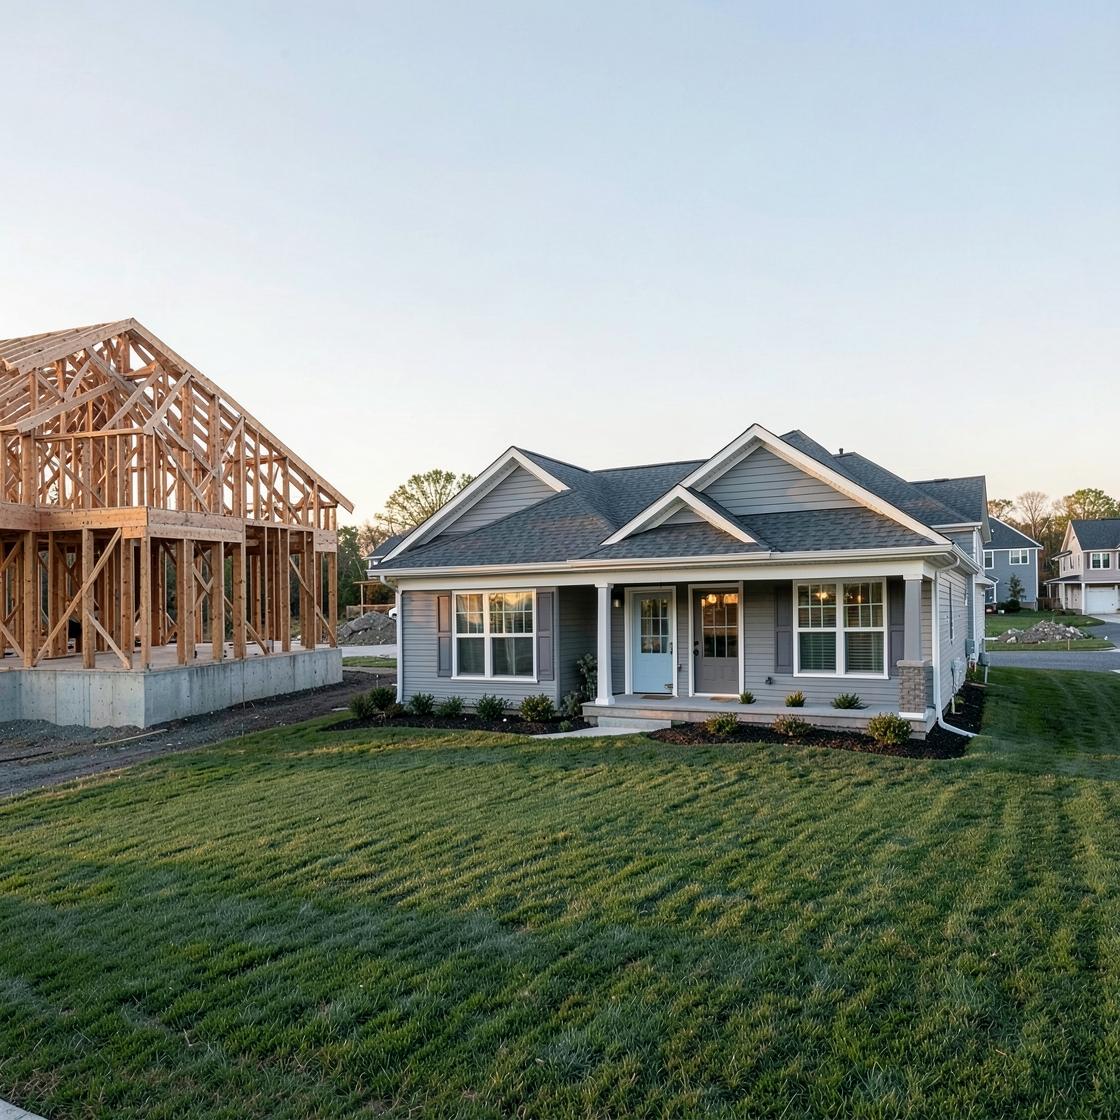
Sales of newly built U.S. single-family homes rose in June, but the useful signal is not the 1.6% headline increase. It is the amount of effort builders are applying to keep transactions moving while mortgage rates remain in the mid-6% range.
The Census Bureau and Department of Housing and Urban Development estimated a seasonally adjusted annual sales rate of 628,000, up from 618,000 in May but 5.6% below June 2025. That is consistent with a market finding a floor only if later data confirm it. For now, the stronger conclusion is narrower: builders can still convert some payment-sensitive demand, but they are doing so in a market with weak statistical momentum, abundant new-home supply and visible pressure on selling economics.
The rebound is smaller than the error band
The monthly increase came with a 90% confidence interval of plus or minus 14.8 percentage points. In plain language, the survey cannot establish that sales actually rose rather than fell. Census also says it takes four months to establish a trend in new-home sales and that preliminary estimates are revised by about 5% on average. The 1.6% move therefore should not be treated as a clean inflection point.
The year-over-year comparison is not decisive either: the reported 5.6% decline has a plus-or-minus 13.2-point confidence interval. Year-to-date sales were 5.2% below the same period of 2025, but that estimate also overlaps zero at the 90% confidence level. These are facts about measurement, not reasons to dismiss the release. They shift attention from one noisy growth rate to the market conditions surrounding it.
Prices offer a similar warning. The median new-home sale price was $398,300, down 2.7% from a year earlier, while the average was $475,400, down 6.5%. Both comparisons carry wide error bands, and Census cautions that price changes also reflect shifts in region, home size and other characteristics. A lower median can signal affordability work by builders, a greater share of cheaper homes, or both; it does not by itself prove broad house-price deflation.
Builders can sell the payment, not just the house
Mortgage costs explain why builders have an advantage over many existing-home sellers. Freddie Mac's survey put the average 30-year fixed rate at 6.48% on June 4 and 6.52% on June 11; it later reached 6.58% on July 23. A builder with a captive or partner mortgage operation can spend money to lower a buyer's initial or permanent rate, cover closing costs, or redesign the product toward a smaller floor plan. A homeowner selling one property usually cannot deploy those tools at scale.
This makes sales volume partly an operating choice. NAHB's builder survey found that 62% of builders used sales incentives in June. In July, that share rose to 63%, 37% cut prices, and builder confidence stood at 34 on a 0-to-100 scale. Incentives can preserve starts, closings and inventory turns, but they transfer part of the affordability problem from the buyer's monthly payment to the builder's income statement.
Company disclosures make that trade-off concrete. Lennar reported a fiscal second-quarter average selling price of $371,000 after incentives of about 12.9%. Its home-sales gross margin was 15.6%, compared with 17.8% a year earlier, though higher land costs, lower construction costs and mix also affect margins. In a separate filing, Hovnanian said greater use of incentives and mortgage-rate buydowns was the primary reason its gross margin fell to 10.2% from 13.8%, while explicitly prioritizing sales pace over higher margin.
Those examples do not prove that every June sale was incentive-driven. They do show the mechanism investors need to monitor: a sales rebound can coexist with weaker unit economics.
Supply is available, but not interchangeable
The headline inventory was 485,000 homes, equivalent to 9.3 months of supply at June's sales pace. That sounds heavily stocked, yet the construction-stage split matters. Of the seasonally adjusted total, 113,000 homes had not been started, 254,000 were under construction and 118,000 were completed. A buyer cannot occupy a planned or unfinished home immediately, and a builder has more flexibility to alter specifications or pace before completion than after capital is locked into a finished unit.
Geography and price mix further complicate the aggregate. Homes priced below $300,000 made up 23% of June sales, up from 16% a year earlier. NAHB's analysis of the release noted that this price point is more achievable in markets with lower development and regulatory costs. Year-to-date sales rose 2.6% in the Midwest but fell in the Northeast, South and West. The national median therefore combines markets with different land costs, inventories and buyer constraints.
This is why nine months of supply is not nine months of equally affordable, move-in-ready choice. The financial consequence differs by builder: companies with land flexibility, lower-cost markets and mortgage capacity can defend volume more efficiently than those carrying completed inventory in weaker submarkets.
A housing turn needs confirmation beyond contracts
The bullish interpretation deserves weight. New-home sales can improve before existing-home sales because builders control inventory, product design and financing. June also showed a larger share of sub-$300,000 transactions, evidence that supply can move toward the constrained end of demand. If mortgage rates decline, builders may be able to reduce incentives while keeping orders stable, allowing margins to recover.
But a signed contract is recorded as a sale before construction is finished, and it can later be cancelled. A durable turn would require several months of stronger sales, stable or falling cancellation rates, less completed inventory and fewer incentives—not simply one annualized estimate. For homebuilder investors, orders without margin discipline would be a lower-quality recovery; for the wider economy, sales supported by permanent affordability gains would transmit more strongly into construction, furnishings and household formation than sales supported by temporary subsidies.
The evidence that would change this analysis is specific. Falling mortgage rates accompanied by stable orders and improving gross margins would show that underlying demand is replacing incentives. Conversely, a rise in completed inventory, deeper price cuts or further margin compression would indicate that builders are buying volume rather than discovering broad pricing power. June keeps both scenarios open; it does not settle between them.